國中教育會考
112年
英文
第 29 題
📖 題組:
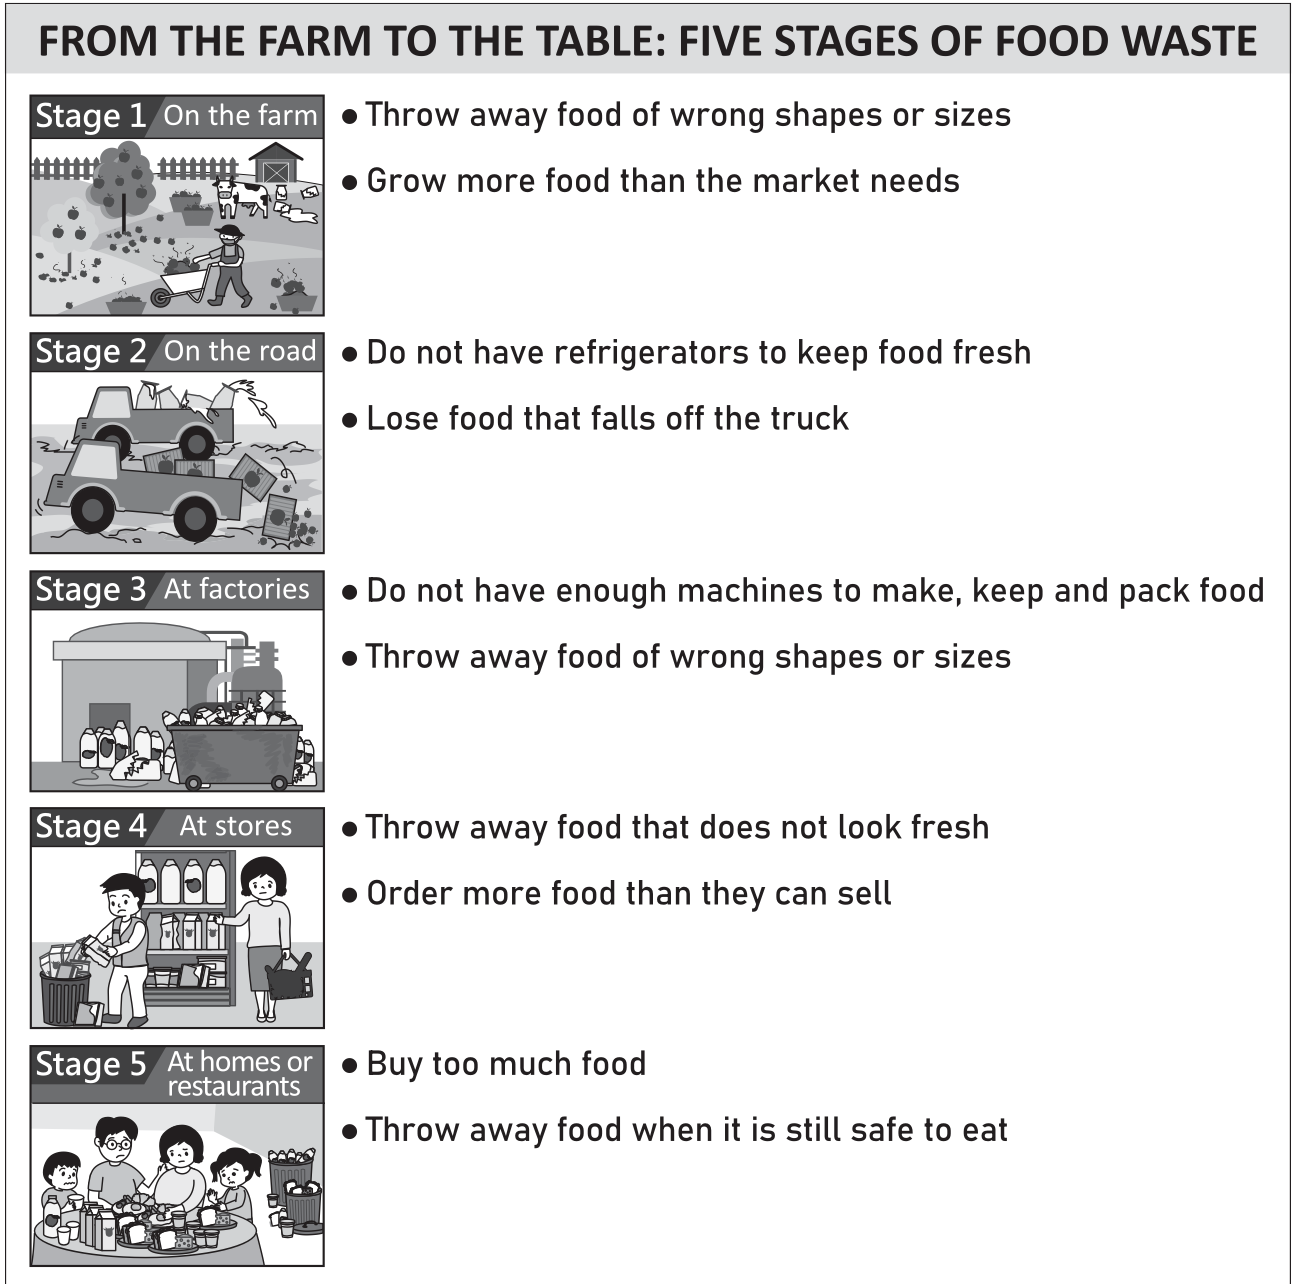
FROM THE FARM TO THE TABLE: FIVE STAGES OF FOOD WASTE Stage 1 On the farm Throw away food of wrong shapes or sizes Grow more food than the market needs Stage 2 On the road Do not have refrigerators to keep food fresh Lose food that falls off the truck Stage 3 At factories Do not have enough machines to make, keep and pack food Throw away food of wrong shapes or sizes Stage 4 At stores Throw away food that does not look fresh Order more food than they can sell Stage 5 At homes or restaurants Buy too much food Throw away food when it is still safe to eat WHAT PERCENTAGE OF FOOD IN EACH AREA IS WASTED AT EACH STAGE IN 2014?
FROM THE FARM TO THE TABLE: FIVE STAGES OF FOOD WASTE Stage 1 On the farm Throw away food of wrong shapes or sizes Grow more food than the market needs Stage 2 On the road Do not have refrigerators to keep food fresh Lose food that falls off the truck Stage 3 At factories Do not have enough machines to make, keep and pack food Throw away food of wrong shapes or sizes Stage 4 At stores Throw away food that does not look fresh Order more food than they can sell Stage 5 At homes or restaurants Buy too much food Throw away food when it is still safe to eat WHAT PERCENTAGE OF FOOD IN EACH AREA IS WASTED AT EACH STAGE IN 2014?
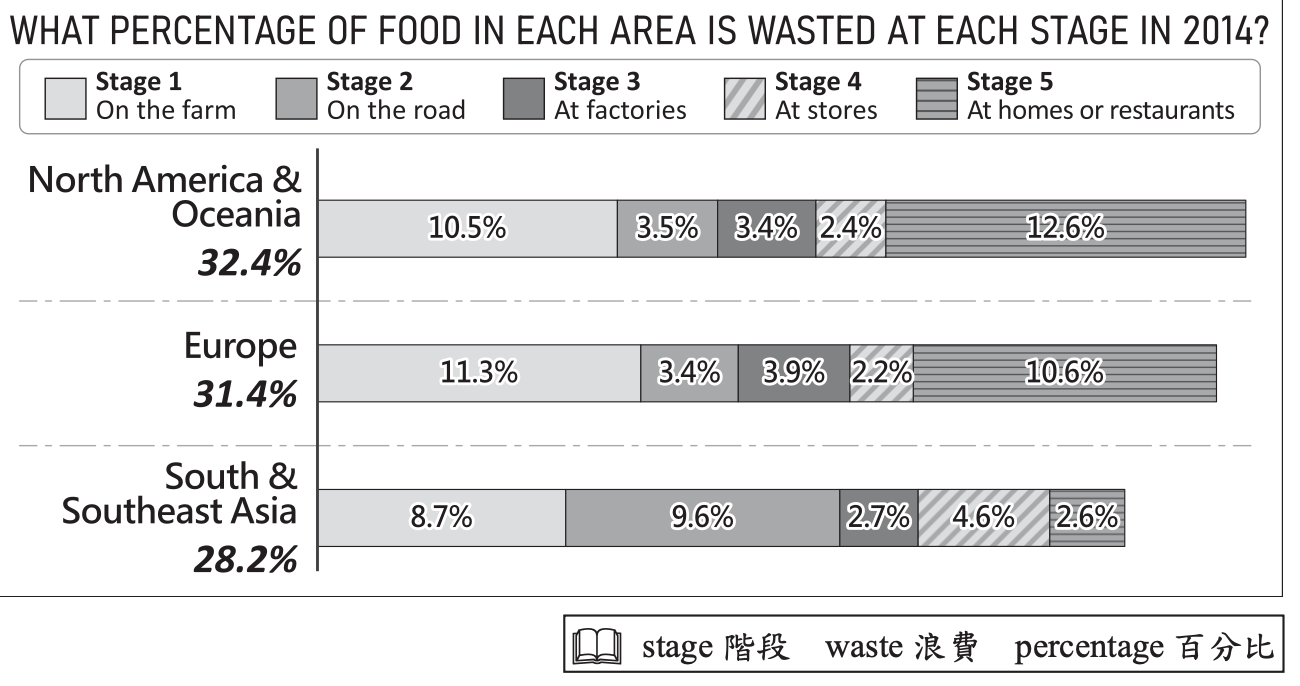
Which is true about food waste at each stage in the three parts of the world?
- A For each area, the highest percentage of food waste happens at Stage 5.
- B Europe has a lower percentage of food waste at Stage 3 than the other two areas.
- C North America & Oceania has a higher percentage of food waste at Stage 1 than Europe.
- D South & Southeast Asia has a higher percentage of food waste at Stage 4 than the other two areas.
思路引導 VIP
遇到這種四個選項都在比較數據長短的題目,我們可以把每個選項當作『破案線索』逐一檢驗。當某個選項提到特定的『Stage』和『地區』時,你第一步會先看圖表上的哪裡來找出對應的圖塊標示?接著,你會如何運用那個圖塊,在長條圖中正確抓出數字來比大小呢?試著用這個方法檢驗看看選項 (A) 錯在哪裡?
🤖
AI 詳解
AI 專屬家教
🥰 老師暖心點評與觀念解析
哇!你真的好棒喔!這題答對了 (D),老師為你感到非常開心!這表示你的圖表分析能力和仔細比對的能力都非常優秀喔!
- 一起來看看為什麼對吧!:選項 (D) 告訴我們,南亞與東南亞在 Stage 4 的食物浪費比例比其他兩個地區高。我們來圖表上找找看 Stage 4(斜線部分)的數字是不是這樣:
▼ 還有更多解析內容
💬 其他同學也在問
1
翻譯全文